EJ VIDEO BRIEFING
VIDEO IN PROGRESSVideo in progress.
A concise EJ briefing for this research will appear here when it is ready to publish.
01 · LABOUR CONDITIONS
The labour signal is broader than the jobless rate alone.
The July 2026 trend unemployment rate was 4.5%, while derived underemployment was 6.4%. Taken together, the two measures give a 10.8% underutilisation reading: people either seeking work or already employed but wanting and available for additional hours. It is a better starting point for assessing capacity in the labour market than one month of employment movement. [ABS Labour Force]
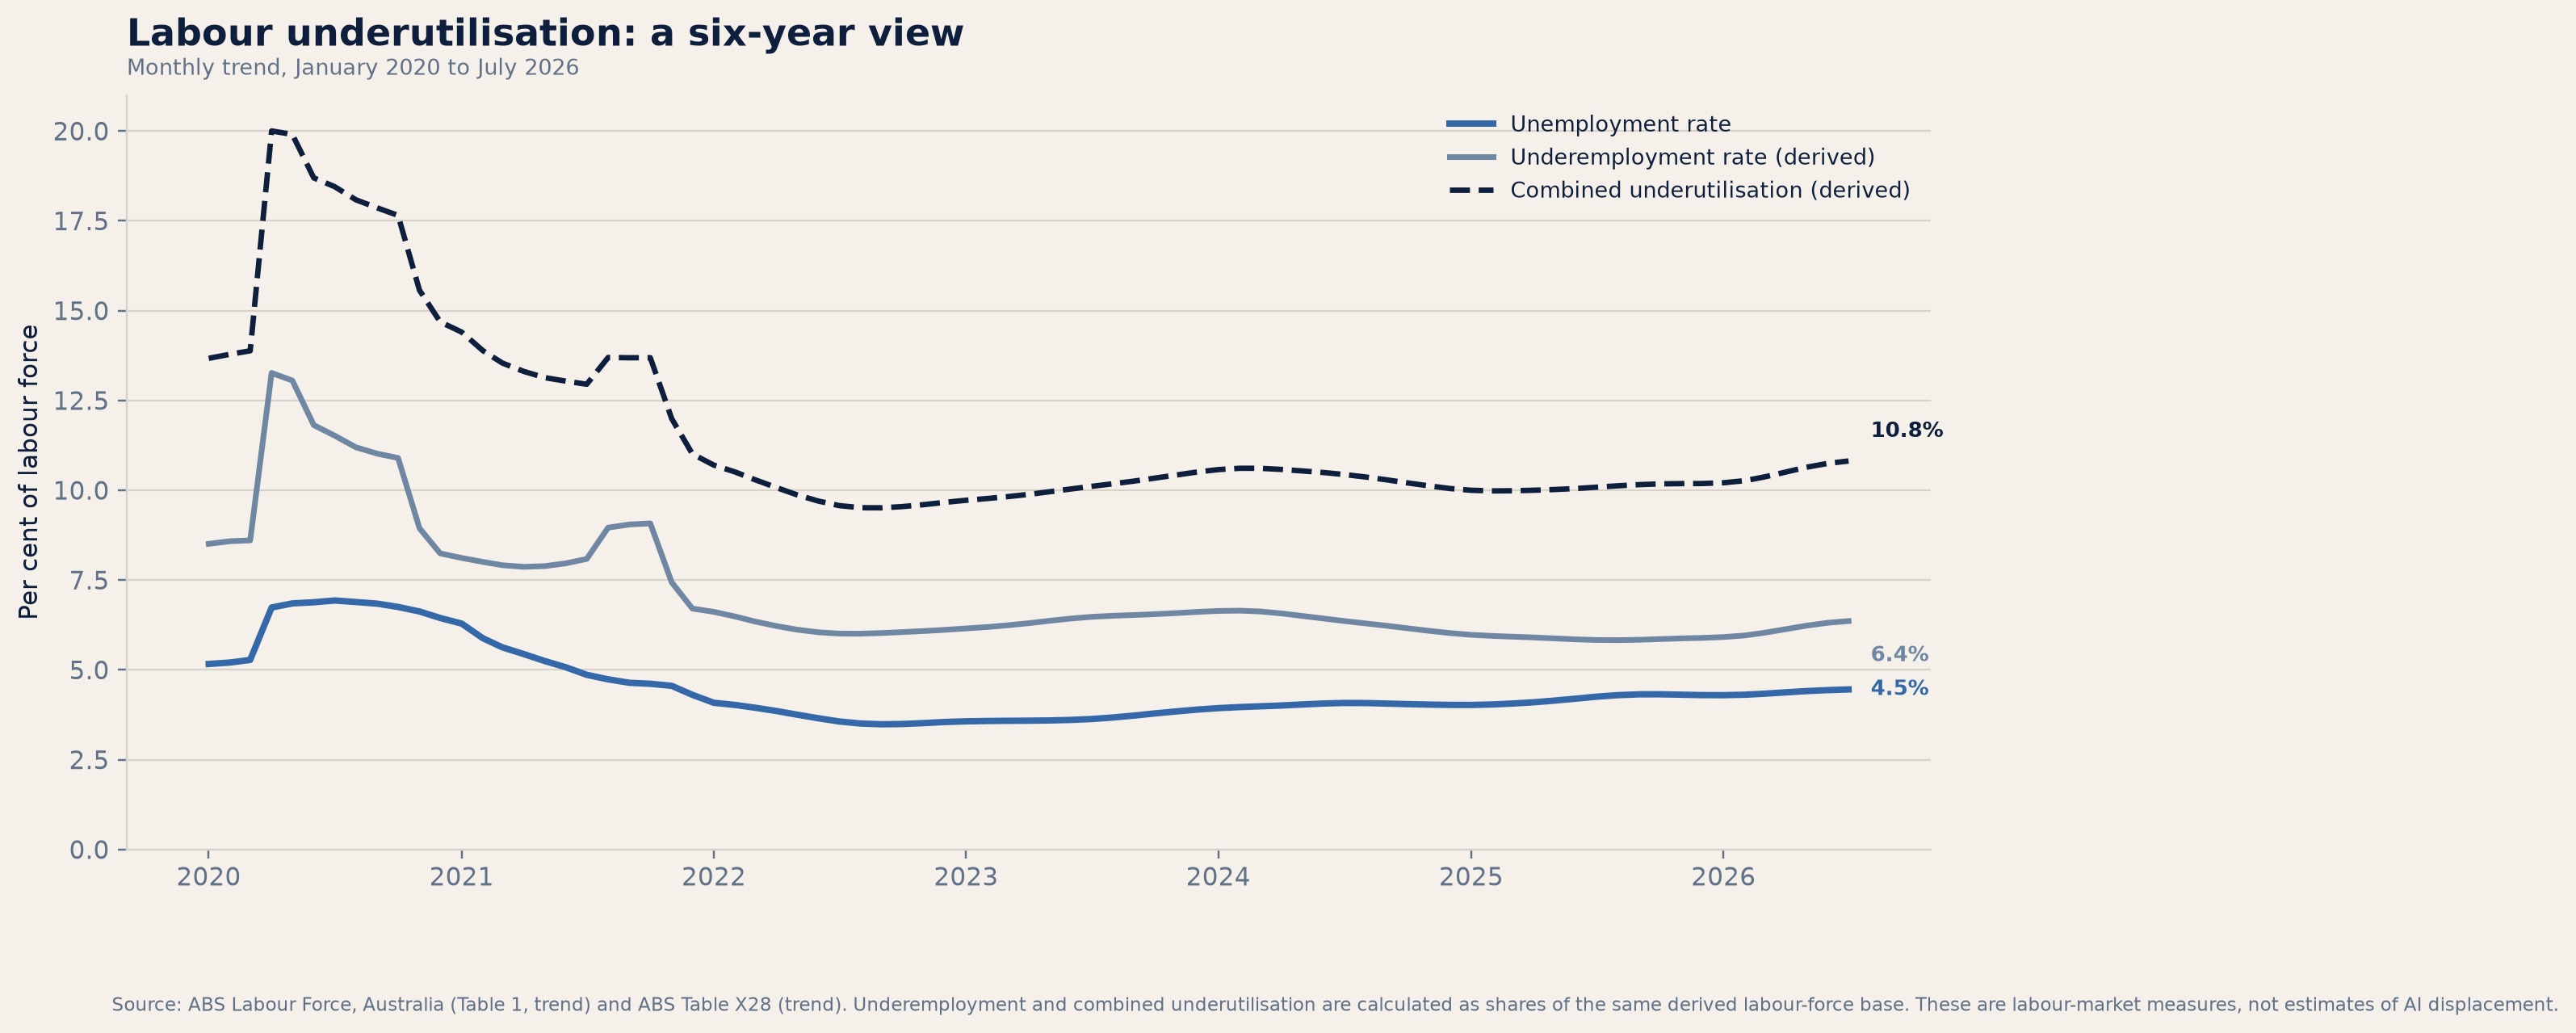
What this trend is trying to say: labour conditions have eased from the unusually tight post-pandemic period, but the official series do not show an economy-wide AI unemployment event. The monitor becomes more concerning only if unemployment, underemployment and employment-hours weakness rise together.
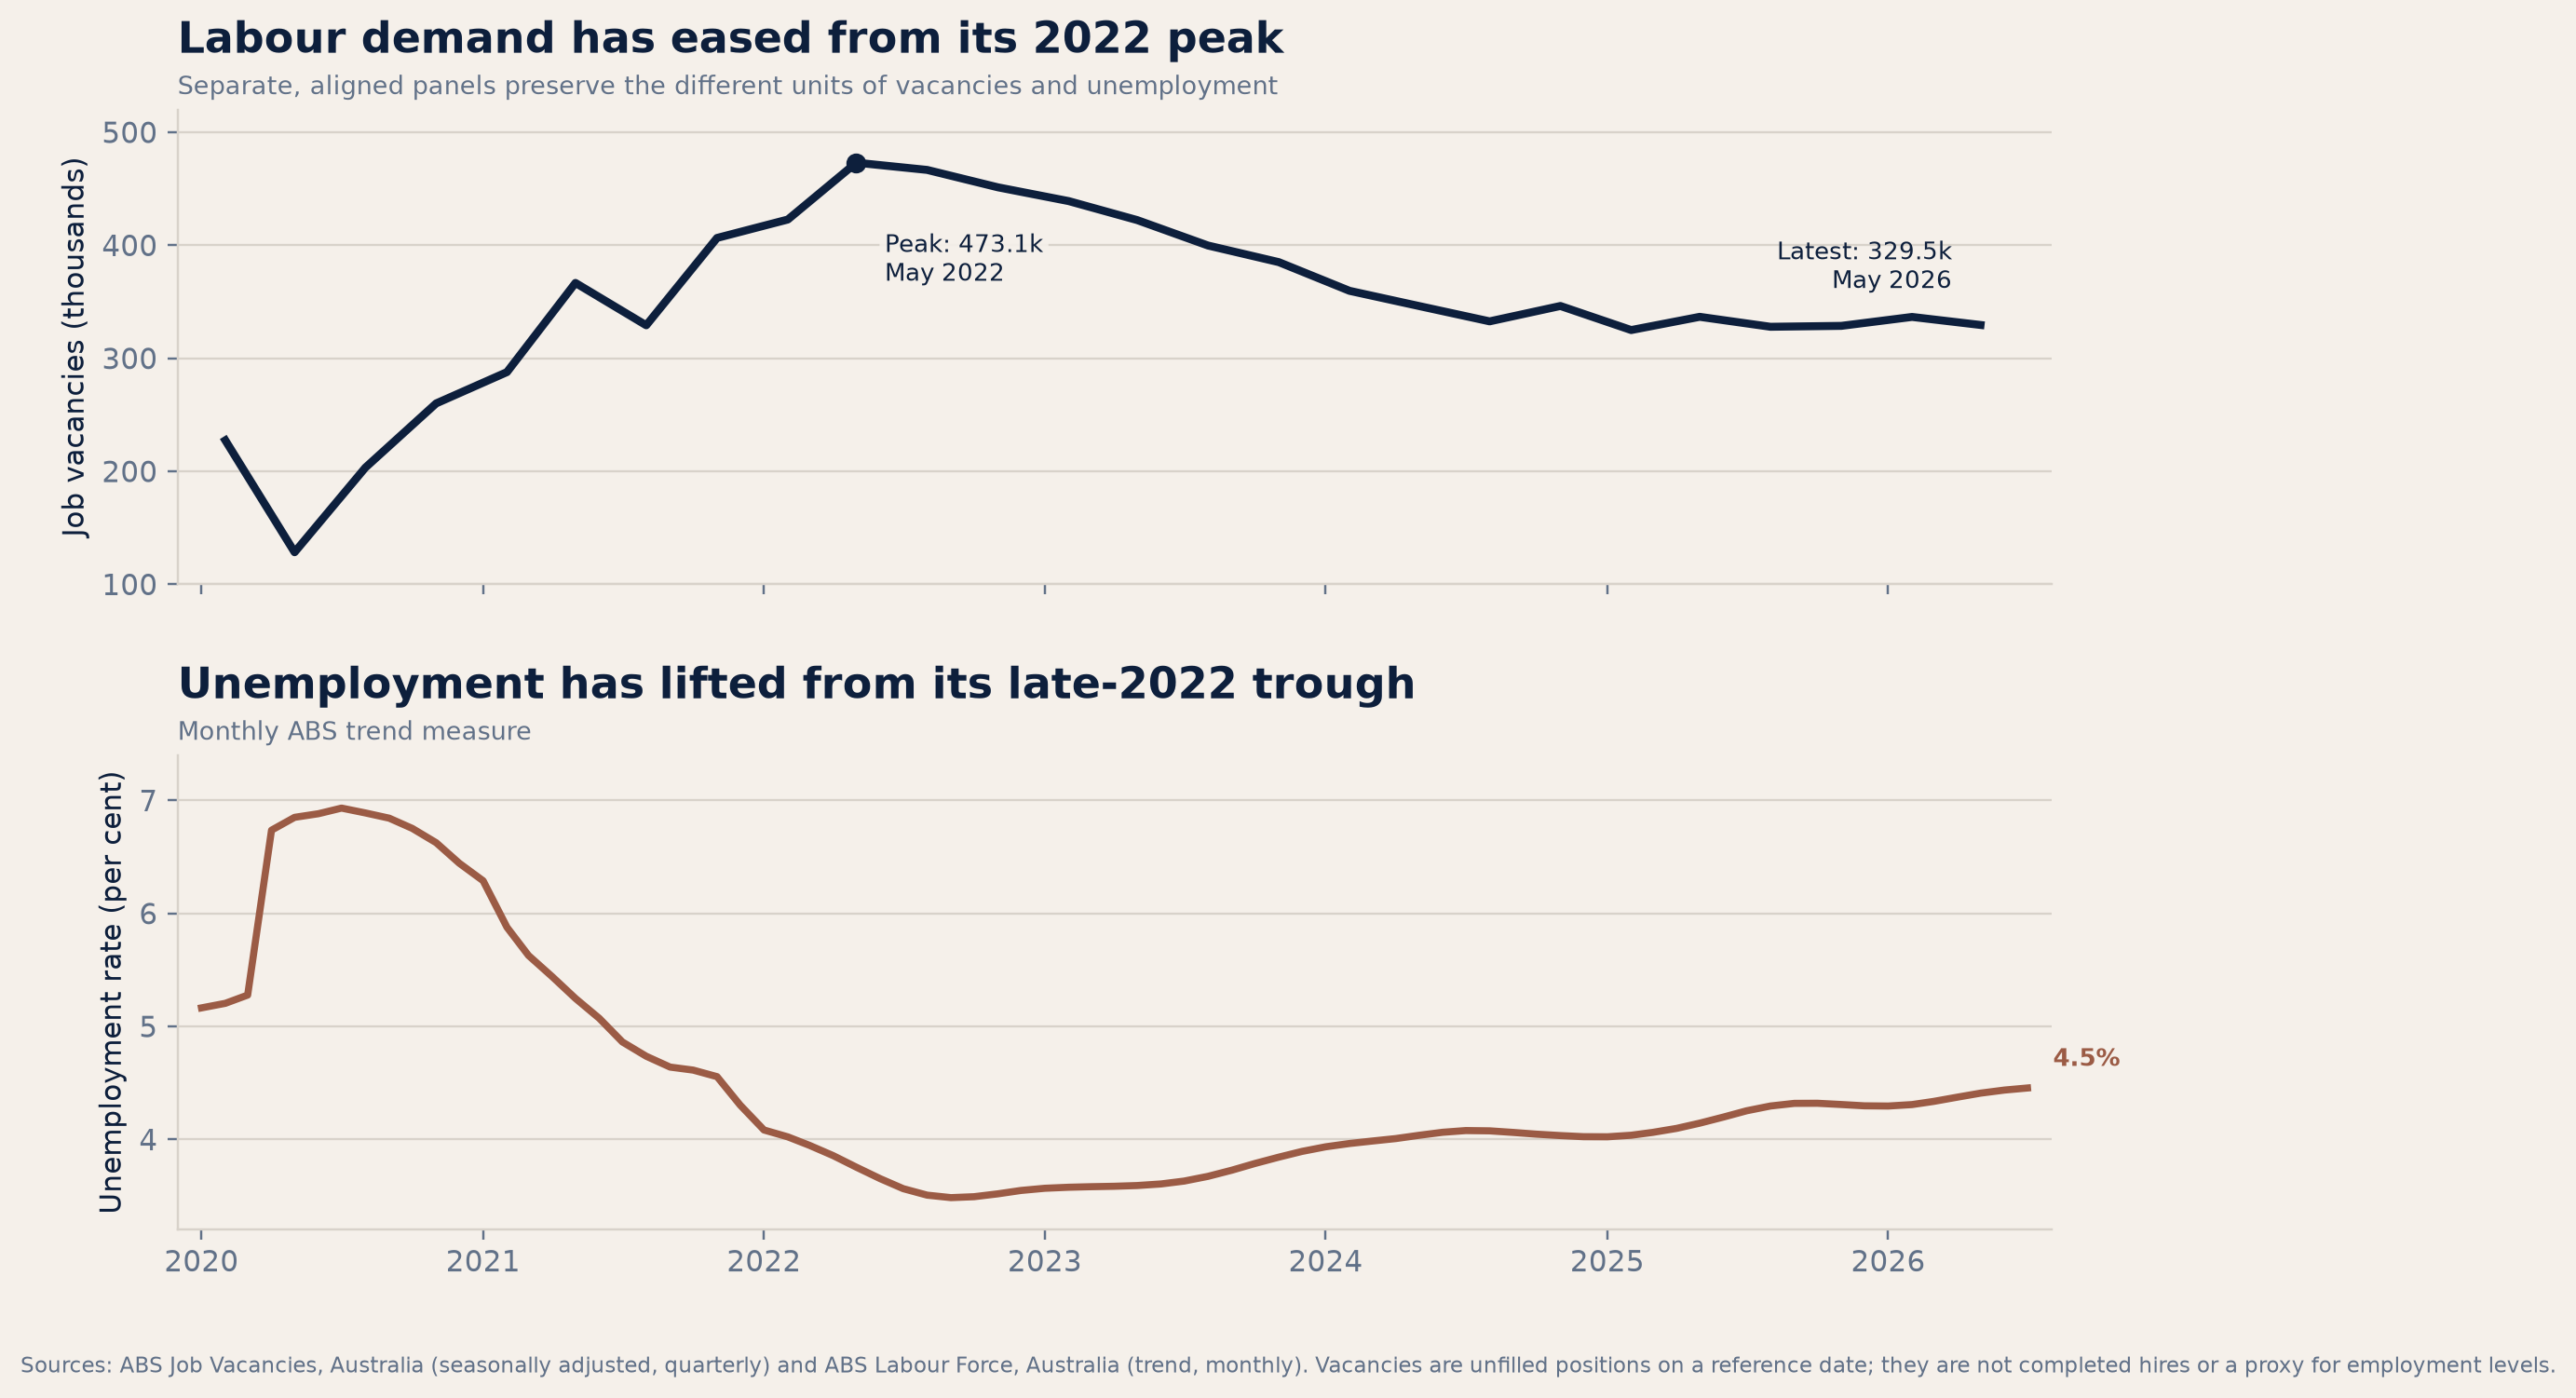
What this trend is trying to say: vacancies fell from 473,100 in May 2022 to 329,500 in May 2026—a 30.4% decline—while unemployment moved above its late-2022 trough. This is a softer demand backdrop, not a completed-hire, layoff or AI-replacement count. [ABS Job Vacancies]
02 · AI-EXPOSED WORKFLOWS
Exposure changes the workflow before it proves a job loss.
Jobs and Skills Australia frames AI effects through exposure, adoption and adaptation. Its task-level work finds that augmentation generally outweighs automation at current capabilities, while routine work has greater automation potential. That is deliberately not a redundancy forecast. [Jobs and Skills Australia]
The credible watchlist includes software development, document production, research, analysis, routine administration and corporate-service workflows. Atlassian and WiseTech demonstrate active global operating-model change; they do not provide a national Australian programmer-job-loss total. Industry series must therefore be read as context, not as causation.
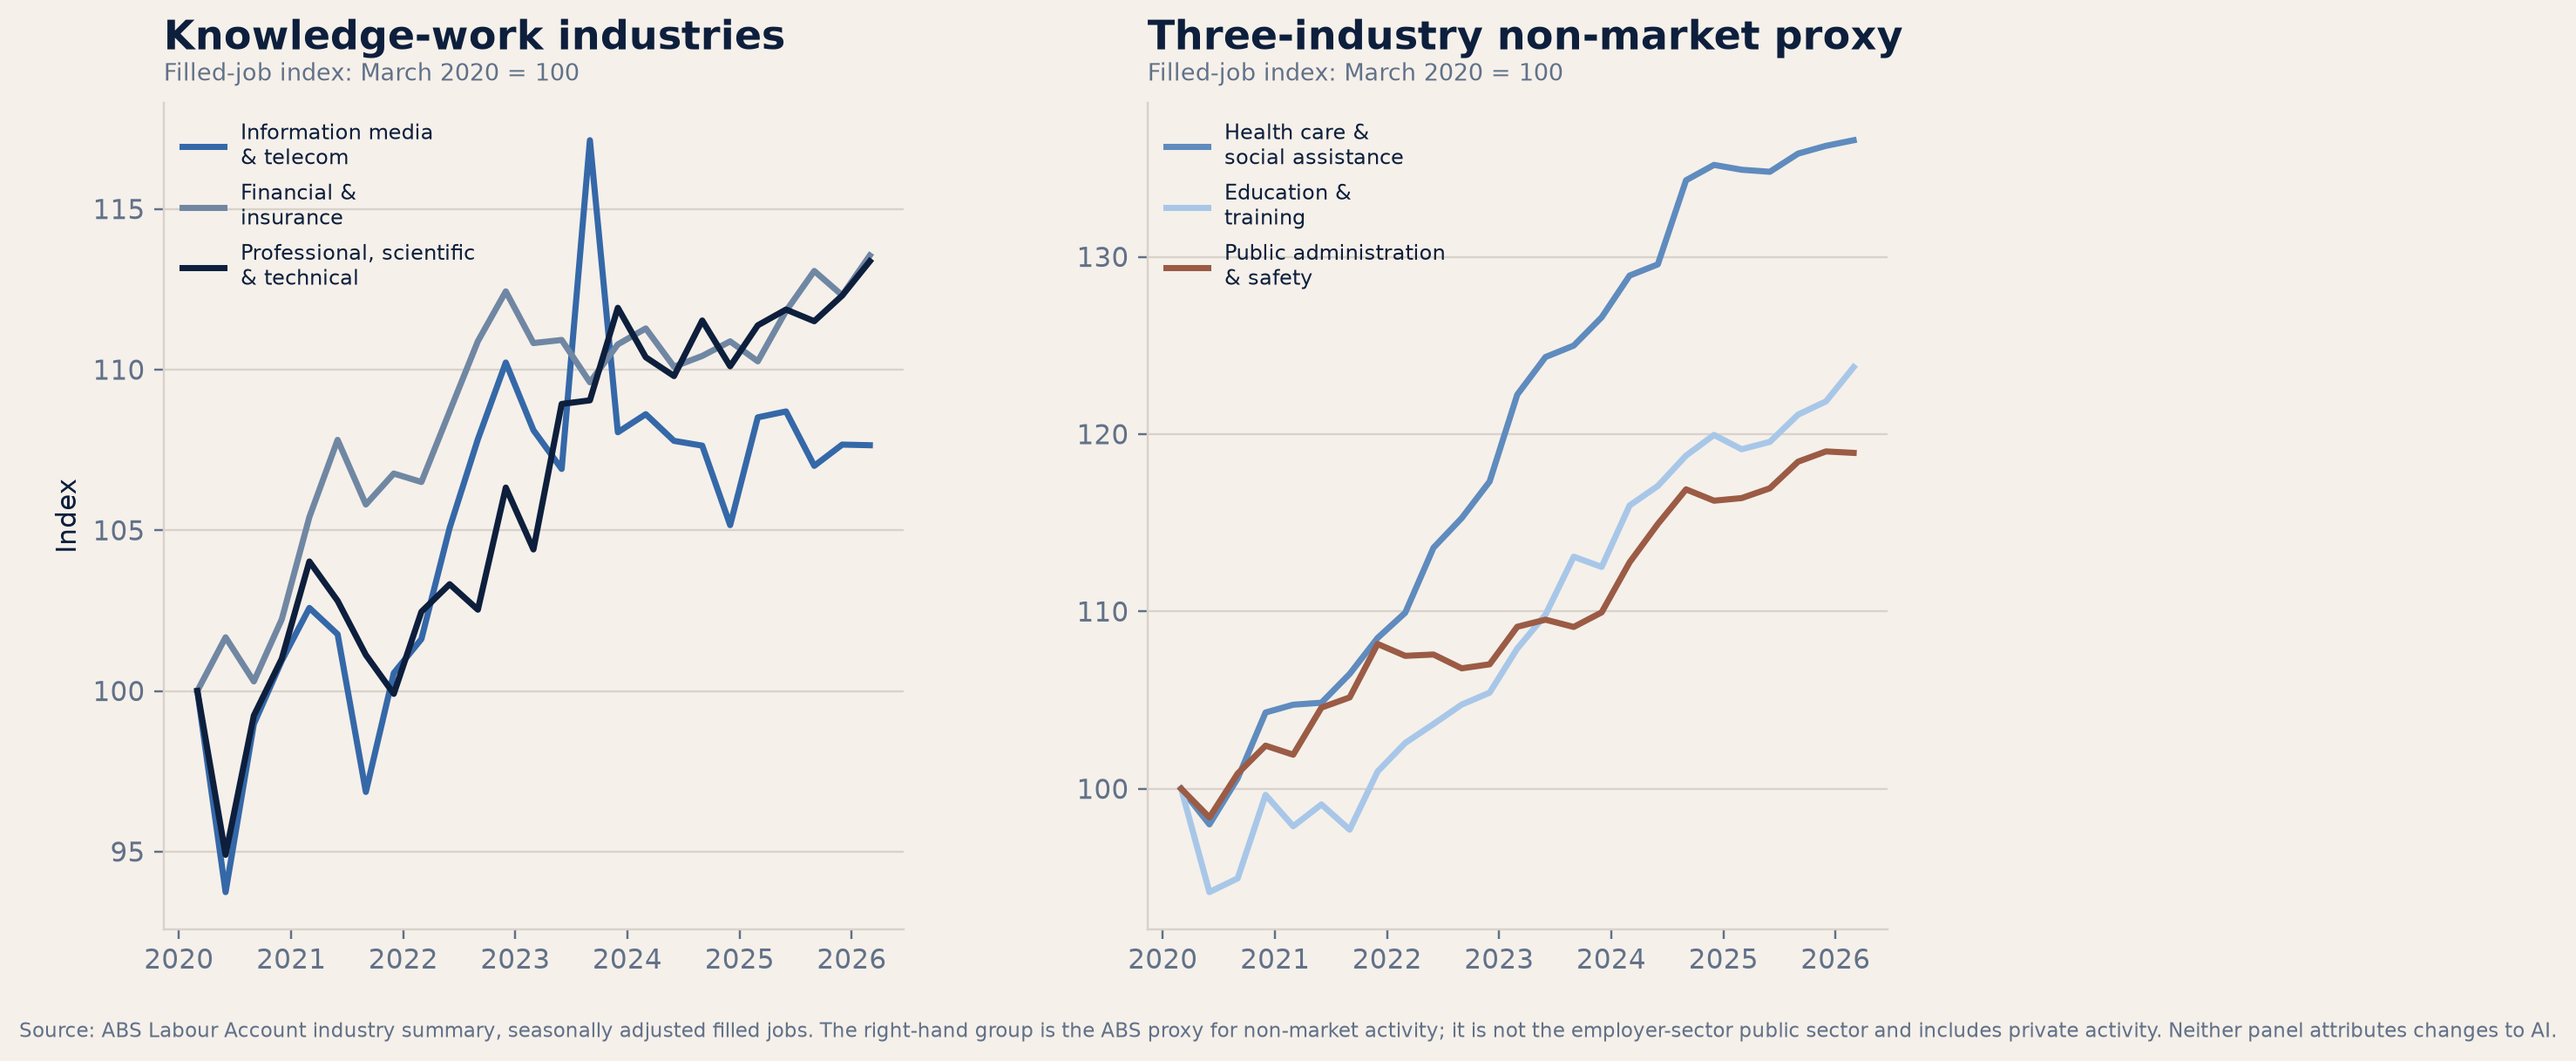
What this trend is trying to say: the knowledge-work lines are not all moving together. From March 2020 to March 2026, Information Media & Telecommunications rose 7.6%, Financial & Insurance 13.6%, and Professional, Scientific & Technical 13.4%. That mixed picture is reason to track occupations and workflows—not to infer one national technology-layoff story. [ABS Labour Account]
03 · HIRING COMPOSITION
The MacroBusiness argument is visible here—and made testable.
MacroBusiness argued that Health Care & Social Assistance, Education & Training, and Public Administration & Safety accounted for 637,273 of 926,425 additional filled jobs between Q1 2023 and Q3 2025, or 68.8% of the increase. Its concern is that headline job growth can look firm while activity becomes increasingly dependent on government-funded or non-market sectors. [MacroBusiness]
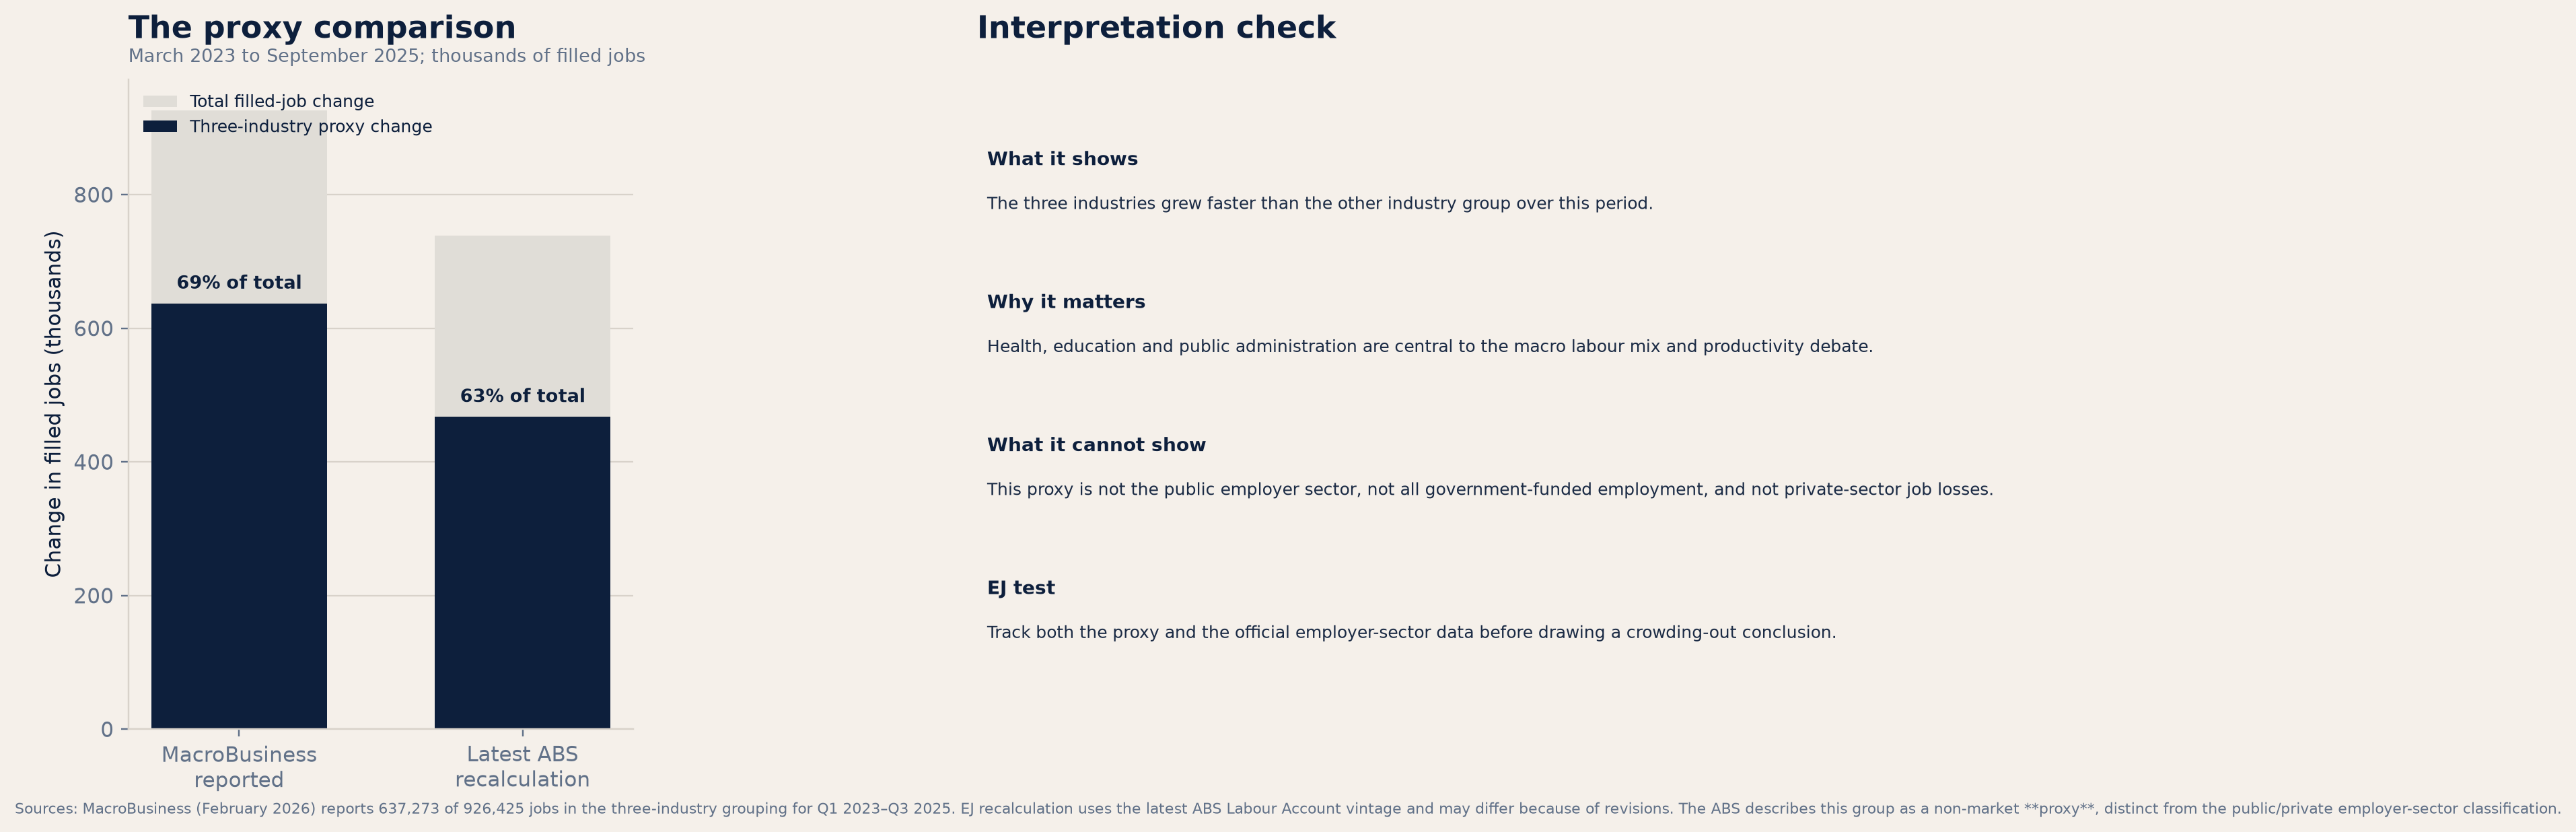
EJ’s recalculation on the latest ABS Labour Account vintage finds 467,600 of 739,200 additional filled jobs—63.3%—in the same three-industry group. That remains a material composition signal. It is not, however, the ABS public-employer sector and cannot on its own prove that private-sector employment is contracting or that government hiring is replacing it. Health, education and social assistance include private activity, while public funding can reach contractors. [ABS methodology]
What this trend is trying to say: the composition of employment matters. Concern strengthens if this proxy remains dominant while market-industry vacancies, hours and filled jobs weaken. The conclusion must be checked against the official employer-sector data rather than inferred from a mixed industry grouping.
04 · HOUSEHOLD & BANKING LINK
Bank fragility is a sequence of conditions—not a property-price arithmetic shortcut.
A 10% unemployment rate is a severe arithmetic thought experiment, not a mortgage-default forecast. Applied to the July 2026 implied labour force of about 15.37 million people, it equates to approximately 1.54 million unemployed people—about 845,000 more than July. It does not specify how many people have mortgages, draw down buffers, enter arrears, default or create bank losses.
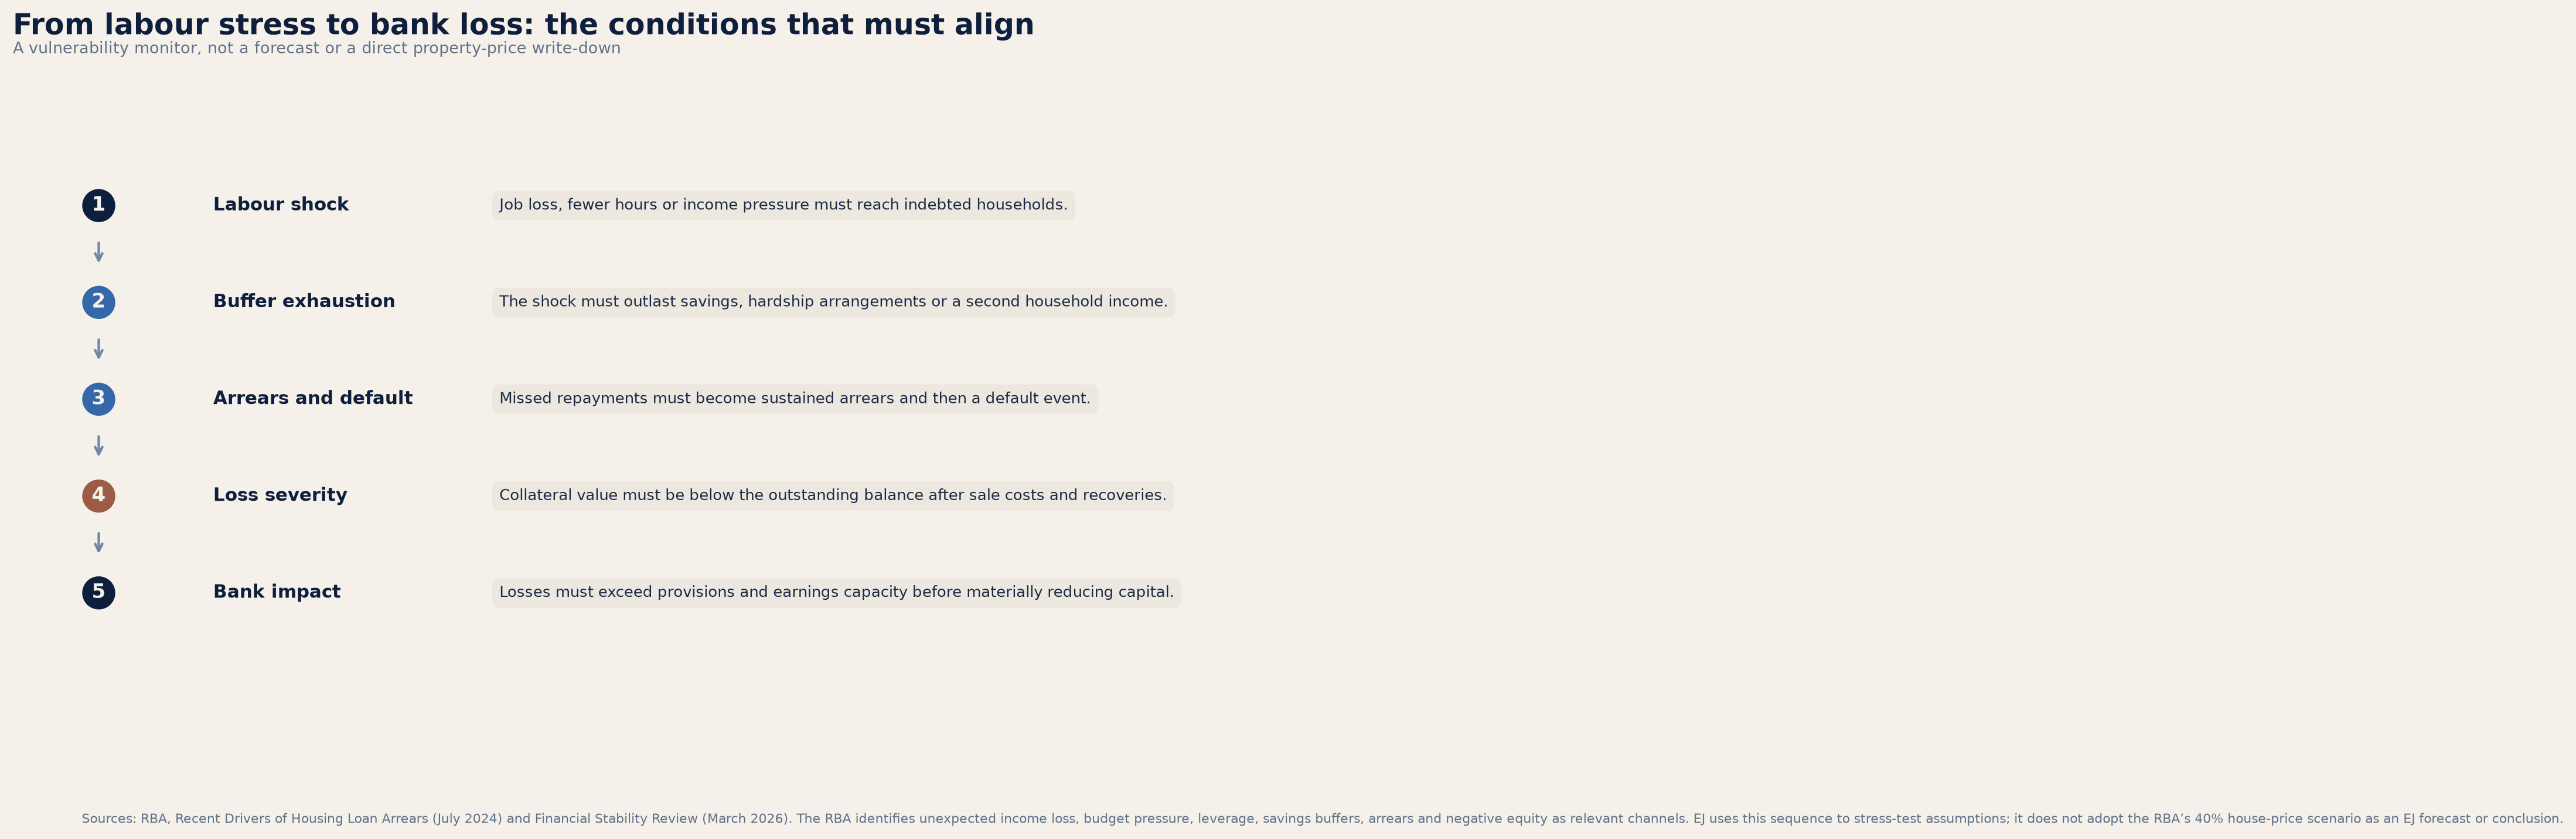
The bank question is deliberately open. Official RBA analysis records low current aggregate arrears and meaningful household buffers, but also notes high household indebtedness, faster credit growth, heightened investor activity and an increase in some riskier new lending. A sceptical assessment should track both sets of evidence. A property-price fall affects collateral values; it becomes a bank loss only after sustained repayment stress, default, recovery shortfall and losses that exceed provisions and earnings. [RBA Financial Stability Review]
What this framework is trying to say: EJ is not adopting the RBA’s severe house-price reference as an EJ conclusion. The key stress test is whether weaker work, fewer hours and income pressure begin to coincide with high-debt cohorts, rising arrears, weaker recovery values, provisions and capital absorption.
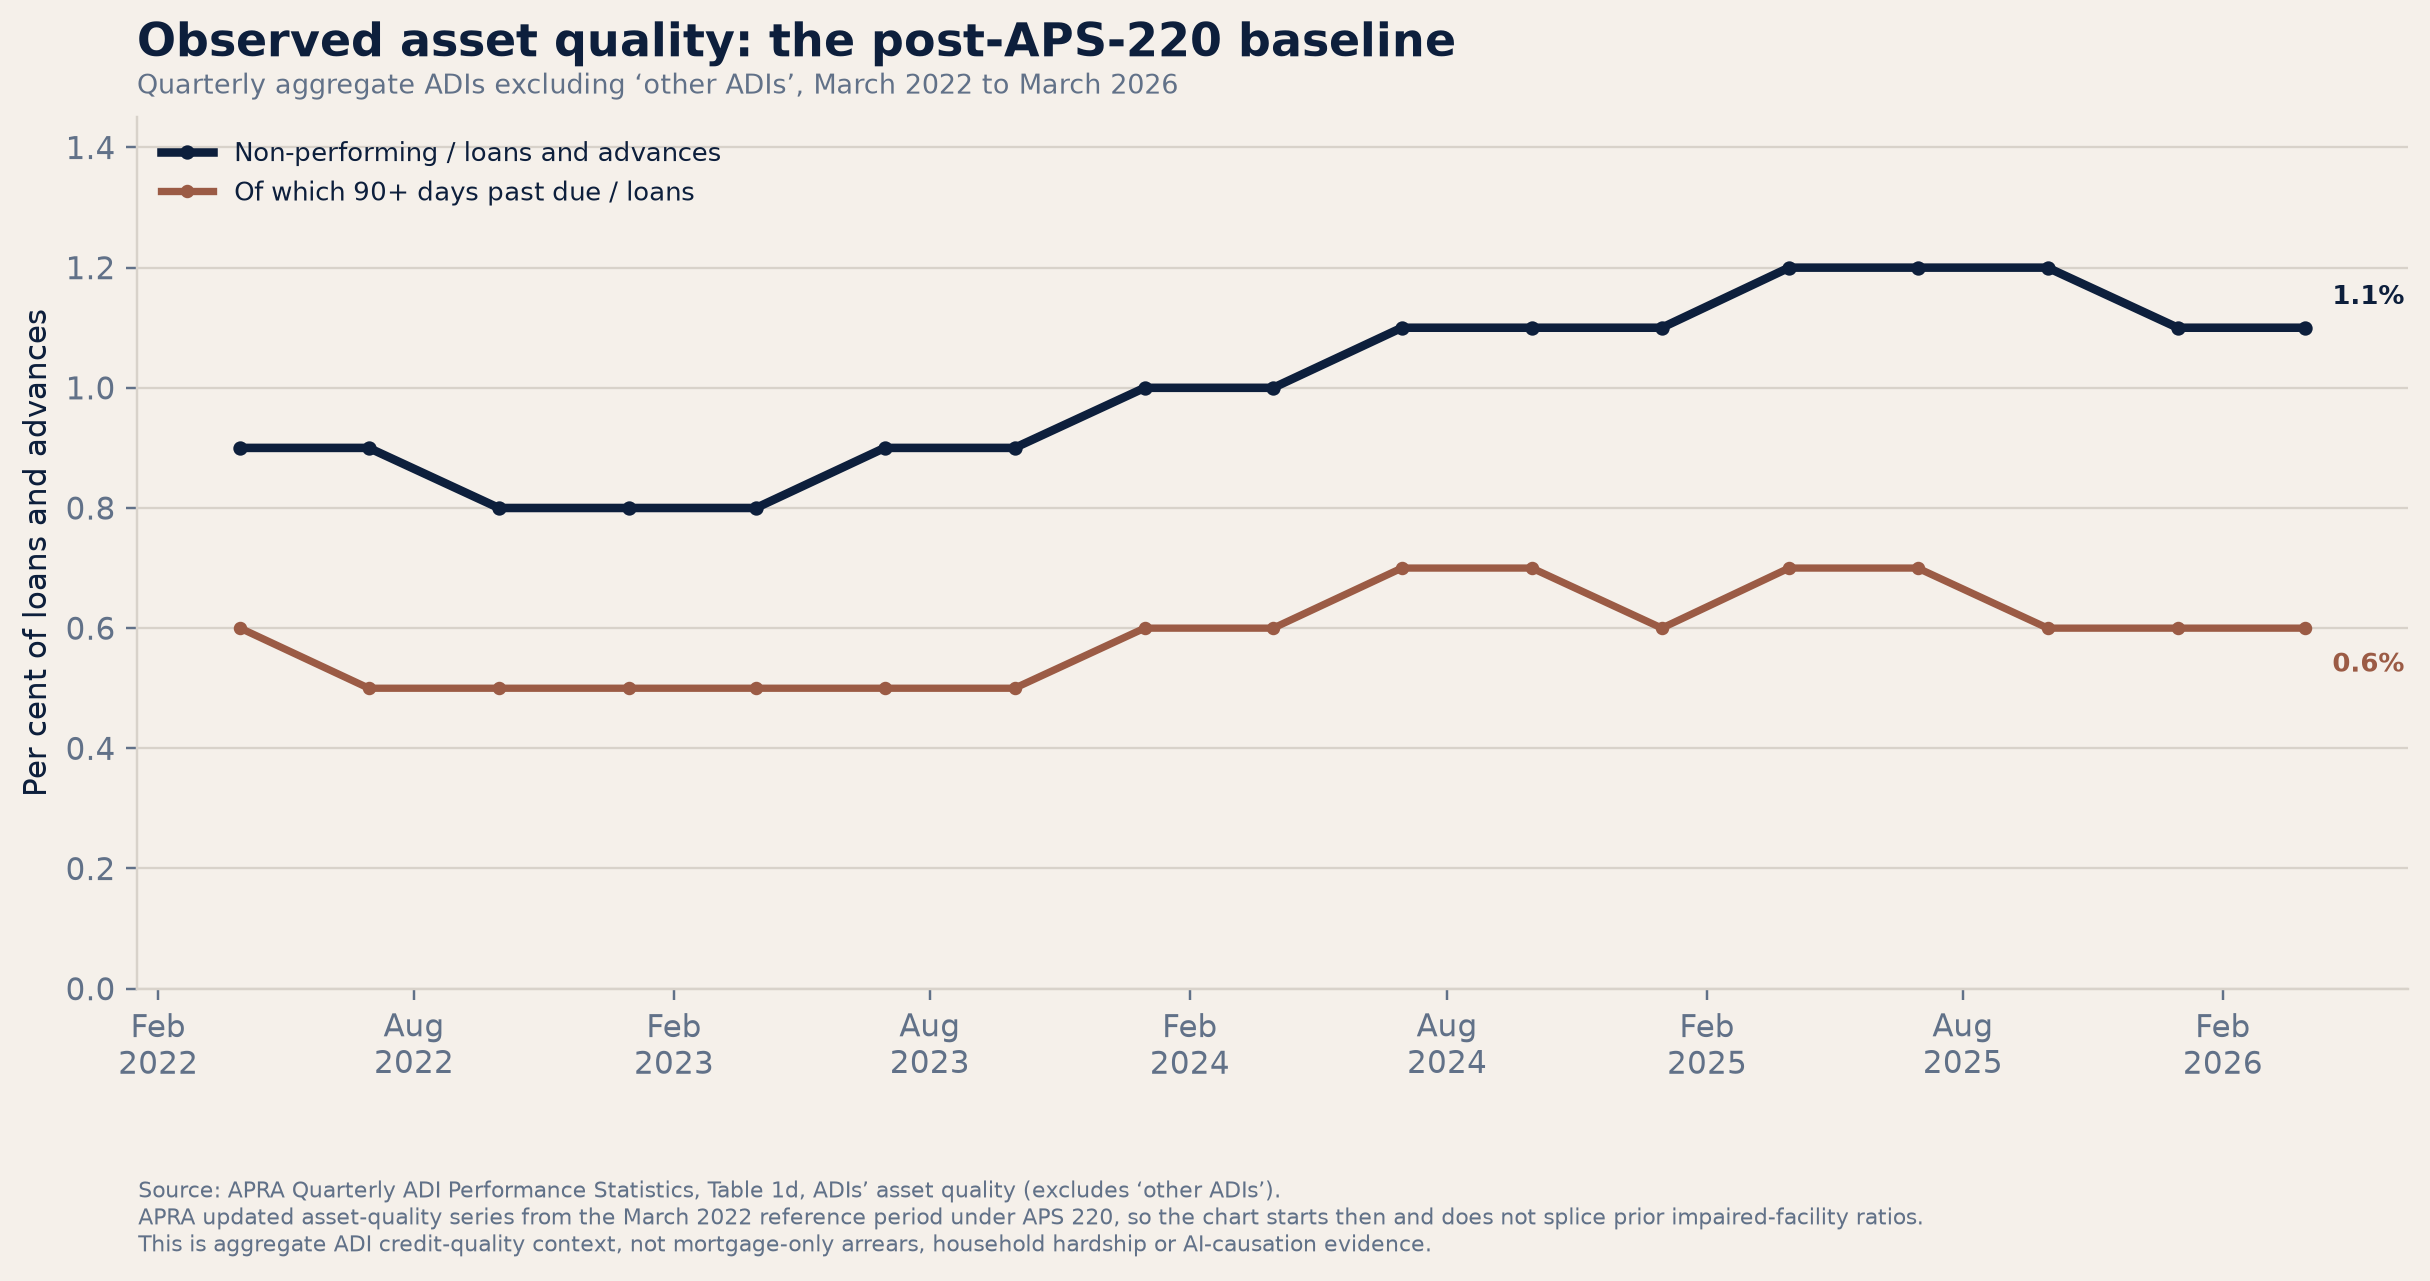
APRA’s aggregate series adds an observable credit-quality baseline. For ADIs excluding APRA’s “other ADIs” segment, non-performing exposures moved from 0.9% of loans and advances in March 2022 to a 1.2% peak in 2025, then 1.1% in March 2026. The 90-plus-days-past-due component was 0.6% in March 2026. This is neither a safety verdict nor a break signal: it records deterioration from post-pandemic lows, followed by modest easing. It is also not a mortgage-only series. [APRA quarterly ADI statistics]
What this trend is trying to say: vulnerability rises if this line moves higher alongside unemployment, hours weakness, housing-specific arrears, high-DTI or high-LVR stress and provisioning needs. Stability would be a countervailing signal—not proof that every bank, loan cohort or property market is unaffected. APRA changed this asset-quality measure under APS 220 from March 2022, so the chart does not stitch it to older impaired-facilities ratios.
RESEARCH DISCLOSURE
This publication is research and analysis only. It is not personalised financial, investment, legal or tax advice; not a recommendation; and not a forecast of AI-driven job losses, unemployment, mortgage defaults, house prices or bank outcomes. MacroBusiness is presented as secondary commentary; company announcements are cited as issuer-specific global operating evidence unless an Australian component is explicitly disclosed.