EJ VIDEO BRIEFING
VIDEO IN PROGRESSVideo in progress.
A concise EJ briefing for this research will appear here when it is ready to publish.
01 · Benchmark
The major-bank system entered FY2025 with materially more reported capital and earnings capacity than a decade ago.
The assessment rebuilds the four-bank asset, equity and statutory-profit history from issuer reporting. The aggregate benchmark is intentionally non-synchronous because CBA has a June year-end while Westpac, NAB and ANZ report to September; it is a directional comparison, not a consolidated financial statement.
The result is a stronger starting-capital picture, but it does not remove the importance of mortgage concentration, funding conditions, credit loss severity or management decisions about distributions.

Key reading: Balance-sheet growth and reported equity both rose, but resilience remains a multi-factor judgement.
02 · Asset composition
Loans are balance-sheet assets; property is normally the security behind them.
The FY2025 asset-mix view shows what each group records on its balance sheet: cash and liquidity, market and other financial assets, loans and advances, and a smaller operating, tax and intangible category. Property pledged by borrowers is generally collateral, not a property asset owned by the bank.
The public property disclosures are not fully comparable. CBA separately identifies in-scope commercial-property drawn lending; NAB provides a commercial-property industry exposure-at-default measure; Westpac and ANZ describe collateral coverage rather than a compatible total. The article keeps those boundaries visible rather than manufacturing a single property-asset share.
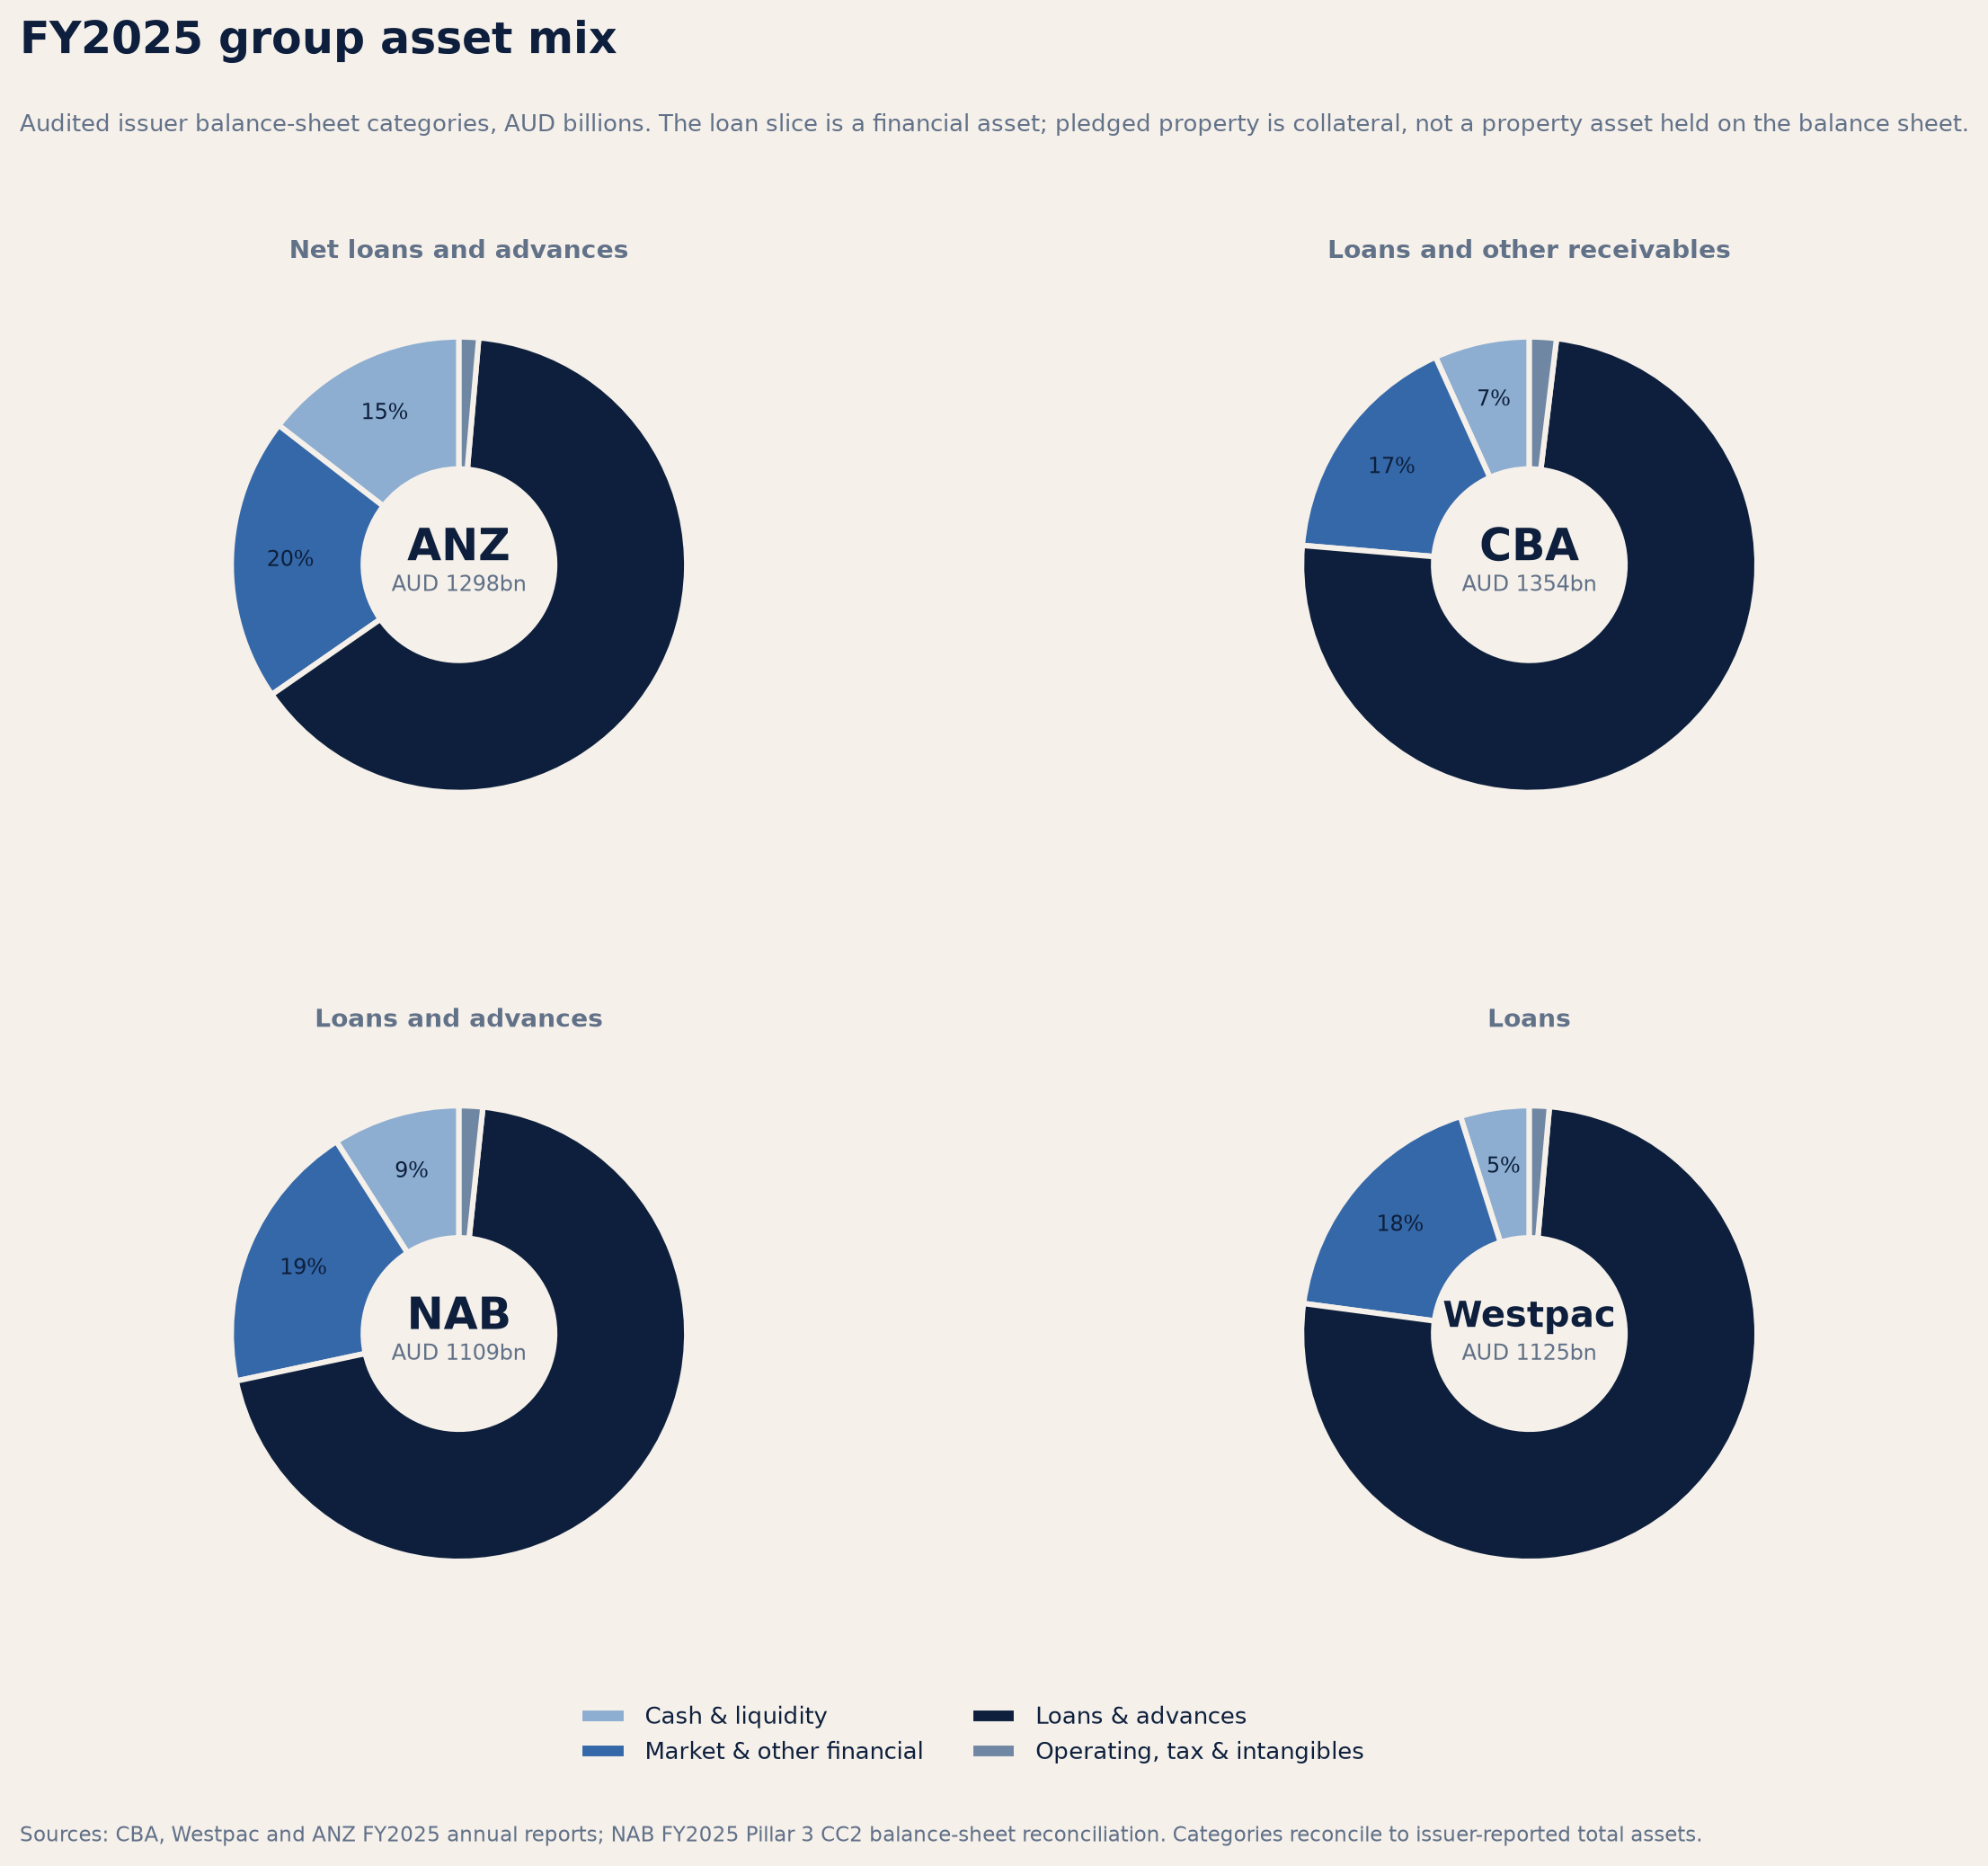
Key reading: The relevant question is the credit-risk transmission from property values to default, recovery, provisions and earnings—not the market value of property as though banks owned it.
03 · Property-loss mechanics
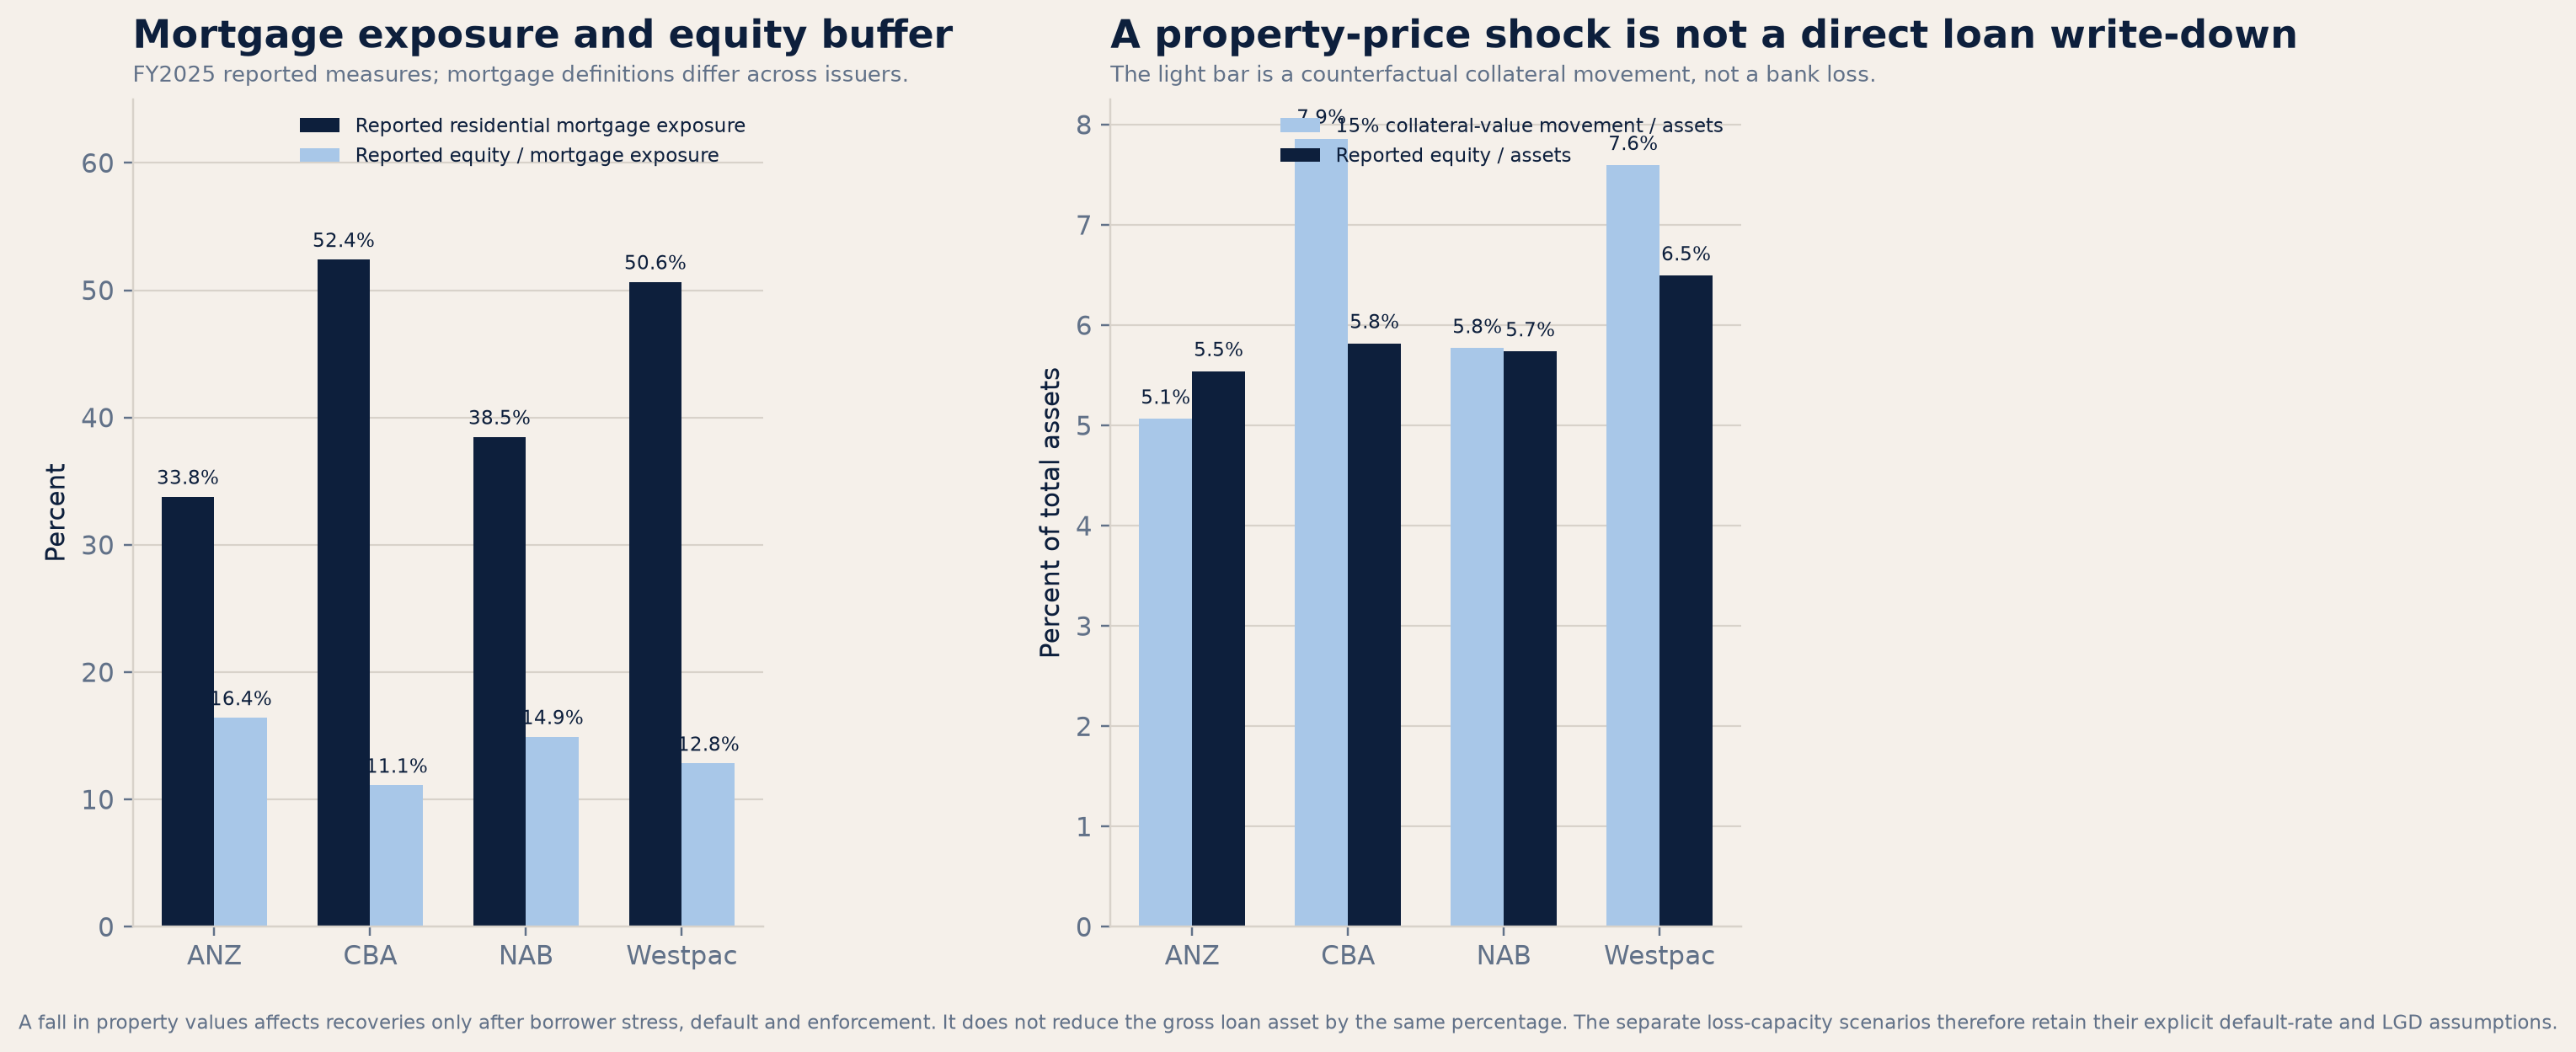
A house-price decline is not the same thing as a bank credit loss.
The report separates the price fall that could create negative equity for a subset of borrowers from the losses that would require defaults, a loss-given-default assumption, provisions and time. That distinction matters: a price shock does not mechanically write down every mortgage exposure by the same percentage.
A 15% property-value movement is shown as a scale illustration only. A loan is recognised as a financial asset; its loss depends on borrower repayment, default probability, loss severity after recovery, expected-credit-loss allowances and the wider earnings and capital base.

Key reading: Negative equity is a trigger condition; realised loss depends on defaults, collateral and workout outcomes.
04 · Distributions
Shareholder distributions need a bridge, not a single payout headline.
The review separates ordinary dividends declared, cash paid during the year, proposed finals, reinvestment arrangements and separately disclosed capital actions. That avoids treating a payout ratio as a universal cash-flow measure.
Where FY2025 execution amounts for a capital action are not separately normalized in issuer reporting, the report does not estimate them or assume they are zero. Those evidence boundaries remain part of the conclusion.
Key reading: Retained earnings and capital actions should be read together with risk appetite—not from a payout ratio alone.